
Math concepts come to life with Wixie
I love to teach math. Its varied techniques and real-world applications allow me to offer creative simulations that actively engage my students. Math is about numbers, but it can also be drawn, manipulated, interpreted, measured, and constructed.
Students are often called upon to look at visual representations of math concepts and interpret what they see. The more opportunities we can give our students to visualize math in different ways, the more prepared they’ll be to comprehend new problems when tested. Tools like Wixie provide students with tools and opportunities to visualize math concepts, helping them build solid foundations that will prepare them to take their math learning to the next level.
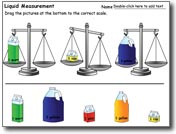
Wixie comes chock full of ready-made activities, templates, and clip art images to help you save time and target standards. The ideas I share below can be found in the Templates folder. Of course, you and your students can create your own lessons to focus on the standards particular to your grade level.
You can use tools like Wixie to import photographs to demonstrate math concepts occurring in the real world. Students can take photos of their classroom, school, and community, and use the paint tools to draw directly on the photos to highlight angles, patterns, numbers, and more.
From counting to division, the tools and activities can be used to help students recognize the patterns and functions of numbers. Students can use the paint tools to draw representations of numbers, including place value, factors, fact families, and rounding. Students can use Math clip art including dominoes, dice, money, base-ten blocks, and (of course) numbers to explore number concepts. For example, using the hundreds charts, the 0-30 charts, and the paint bucket, students can visualize number patterns and concepts of place value, greater than and less than, factors, multiples, and skip counting.
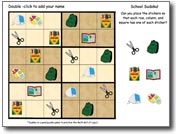
Students can use the shape stickers and all the paint tools to explore symmetry, congruency, and positions in space. The Math folder in the Stickers includes tangrams, pattern blocks and three-dimensional shapes that students can use to open up the worlds of area, perimeter, and coordinates. The geoboard activity template also lets your students explore geometry without the mess of rubber bands!
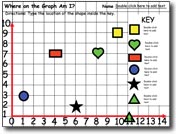
Even the youngest students work with statistics. They call it voting, or graphing, or noticing which tricycle is the most popular. To help students explore the different ways they can interpret data, have them use graphic organizers and picture graphs to represent data. To expand even further, have pictures represent numbers greater than one. Students can also create basic bar graphs using the Paint Bucket tool to fill in a grid.
Students can add the dice stickers to a picture to answer the question, “What are my chances?” Once stickers are “glued” to the canvas, students can re-color them to represent different probabilities. Using printouts of these pictures, students can create real-world experiments to see if their probability estimations hold true.
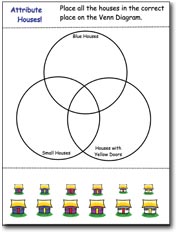
Students can rotate, flip, and resize stickers to explore the attributes of various items, a precursor to more complicated algebraic concepts. Students can use the sorting activities and graphic organizer templates to sort items based on shape, color, size, angle, or whatever other attribute is appropriate. Students can also use pictures to visually represent the associative properties of number sentences, allowing them to substitute a letter or empty box for a picture. They don’t know it, but they’re learning the basics of algebra expressions!
Pictures can also be a creative way to look at algebra through the use of money amounts: “Which of these items can I buy with a quarter and get four cents back in change?” You can change the money amounts based on the level of your students.
Our world can be measured in many ways. Daily we deal with dates, time, fractions, and liquid and linear measurement. Because measurement begins with non-standard measuring, have students use the clip art images in Wixie and Pixie to measure all kinds of lines. They can also use stickers as they practice estimation: “How many elephants will fit in this box?” Elephants in the real world represent weight, so you might also consider pairing this exercise with an activity that asks students to organize stickers according to weight.
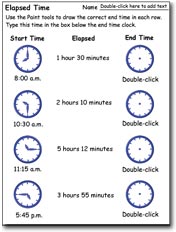
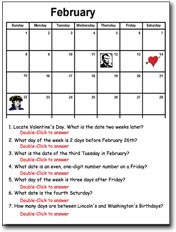
While there are activities for telling time, I like to use the clock stickers to develop my own time manipulatives, asking students to show elapsed time, time of day, and activities for reading clocks. I use the calendar templates to give students practice with interpreting time according to days, dates, and weeks.
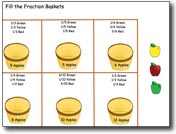
Finding many ways to expose students to fractions and decimal equivalents will help them better understand their concrete meaning. Ask students to use the fraction bars, orange slices, and pieces of pizza to explore fractions as parts of a whole and even how they relate to probability.
Math is unique. Even as students progress on through high school, the strands remain the same – each math skill growing on the one that preceded it. It is in the primary grades where students form the foundations that will support all their future math skills. Giving students an opportunity to visualize math increases their conceptual understanding of mathematical ideas. After all, math is all around us!

Follow us on Instagram for daily inspiration
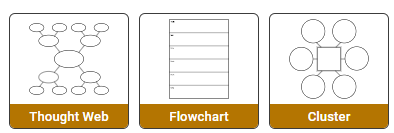
Create a thought web, cluster, flowchart, or other graphic organizer for a lesson
8 first projects to get students using technology
Creative, digital book reviews
Fun and powerful ideas with animated characters
Wixie
Share your ideas, imagination, and understanding through writing, art, voice, and video.
Rubric Maker
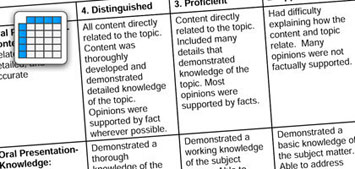
Create custom rubrics for your classroom.

Pics4Learning
A curated, copyright-friendly image library that is safe and free for education.
Wriddle
Write, record, and illustrate a sentence.

Get creative classroom ideas delivered straight to your inbox once a month.
Topics